Debugging
The following section describes a default development workflow for writing AR content using the ARchitect JavaScript API. It demonstrates the code test and debug cycle and provides useful tips for each step.
- Write your HTML, JavaScript and CSS using the text editor of your choice
- Test in your desktop browser
- Debug in your desktop browser using e.g. WebInspector
- Test on a physical device
- Debug on a physical device
- Rinse and repeat
You can use any editor for writing the ARchitect World. We particularly like Sublime, which has a great selection of plugins for web developers.
The next step is to test it out in a desktop browser. To have the ARchitect JavaScript API available in the desktop browser you'll need to include the ARchitect Desktop Engine (ADE). See the chapter ARchitect Desktop Engine for instructions on how to use it. While this is limited in visualizing the experience, it greatly helps in finding errors in the JavaScript code and reduces the time it takes to see effects of changes you have made to the HTML and CSS parts. Desktop browsers come with great debugging tools (e.g. Chrome's DevTools ) that allow you to easily debug your JavaScript code and that you should make full use of when debugging ARchitect Worlds.
Once you have verified the JavaScript is working properly you should test it on the device of your choice. Either start your application that loads the ARchitect World or run it inside the Wikitude World Browser app.
Run the ARchitect World within the Wikitude World Browser on Android
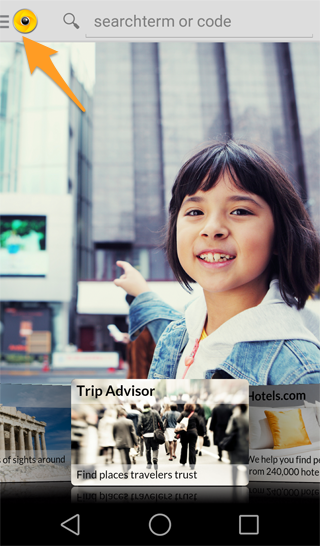
AR experiences can be tested on Android using the Wikitude World Browser for Android. Download the Wikitude app from Google Play. Launch the application and press the menu button in the upper left corner of the screen.
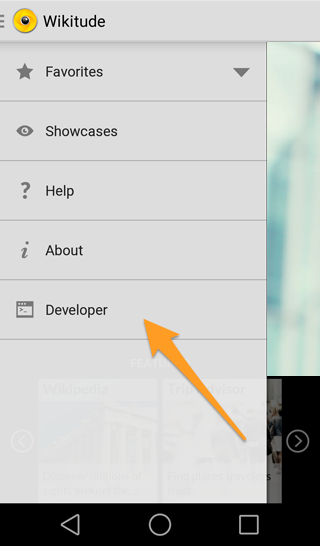
Then tap the Developer button to open the developer login page.
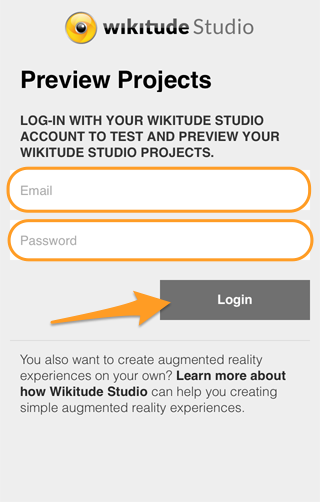
Enter your username and password of your Wikitude developer account and tap the login button to get to your user account. If you don't have a developer account yet register at the Wikitude developer page.
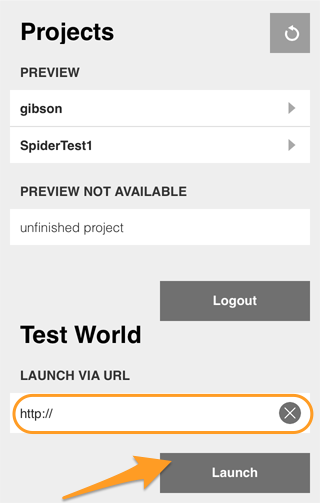
In this view, tap on the text box below the Launch via URL label and enter the URL of your ARchitect World. After tapping the Launch button your AR experience will be opened in Wikitude.
On-Device Debugging Android
Remote debugging is only available for devices running Android 4.4
To enable remote debugging of a WebView add the following line to your Activity conaining the ArchitectView.
WebView.setWebContentsDebuggingEnabled(true);
To actually start debugging follow the steps outlined on the official Android Developer site.